
Translate this page into:
Single Cell RNA Analysis of Glioma Neural Stem Cells Shows Disturbed Amino Acids Metabolism and Axonal Growth Cone Dynamics in Glioblastoma Multiforme
*See End Note for complete author details
Cite this article as: Vaja R. Single Cell RNA Analysis of Glioma Neural Stem Cells Shows Disturbed Amino Acids Metabolism and Axonal Growth Cone Dynamics in Glioblastoma Multiforme. Global Journal of Medical Students. 2022 Nov 10;2(2):5-14.
Corresponding author: Rutvi Vaja, School of Science, Department of Biomedical Sciences, Navrachana University, Vadodara, Gujarat, India. E-mail: vajarutvi@gmail.com
-
Received: ,
Accepted: ,
Abstract
Glioblastoma multiforme(GBM) is a group of aggressive tumors of the central nervous system. Despite advancements in the treatment of GBM, patients diagnosed with these tumors typically have a poor prognosis and poor quality of life as the disease develops. The single-cell RNA high-throughput sequencing processed data for Glioma cancer stem cells were taken from GEO and analyzed to find out the underlying expression differences at the gene level between glioma neural stem cells(GSCs) and Normal neural stem cells(NSCs). In the current study, we have performed an RNA-sequencing analysis between GSCs and NSCs to better understand the origin of GBM. We have performed bioinformatics analysis on the transcriptional profile of 134 samples which consisted of 75 GSCs and 59 NSCs obtained from the NCBI bio project(PRJNA546254). First, an exploratory analysis was performed which showed significant variation patterns between GSCs and NSCs. Subsequently, Deseq2 differential gene expression analysis identified 1436 differentially expressed genes be-tween GSCs and NSCs[(padj. value <0.05, log2 fold change (>=+/-1.5)]. This study reveals genes like MAOA, MAOB, GATM, GLDC, AMT, and SHMT1 as the key features contributing to the disturbed processes of Glycine, threonine, and serine amino acid metabolism, axonal cone growth curve, and cell migration in Glioma. Conclusively, our study also depicts gene expression changes in amyloid beta-binding protein in between GSCs and NSCs which plays an important role in tumor microenvironment formation. Besides, the results presented here reveal new insight into the progression of GBM and the identification of novel genes involved in gliomagenesis.
Keywords
Glioblastoma Multiforme
Neural stem cells
Extracellular Matrix
Gliomagenesis

INTRODUCTION
Glioblastoma Multiforme(GBM) is the most common malignant brain tumor.1 GBM accounts for the most aggressive brain tumors arising from glial cells.2 It has a median survival rate of 12.6 months.3 GBM has widespread and infiltrative development into adjacent brain tissue, increased cell growth, the ability to overcome cell death and antitumor immune responses, and therapeutic resistance.4 GBM recurrence is linked to (i) radio- and chemotherapy resistance; (ii) diffuse features due to tumor cells’ invasiveness properties over the surrounding brain parenchyma; and (iii) tumor intra- and inter-heterogeneity.5 GBM has no risk factors other than rare instances of genetic predisposition and irradiation exposure.7 GBM most commonly occurs in the cerebral hemispheres, with 95 percent of tumors occurring in the supratentorial region, compared to only a few percent in the cerebellum, brainstem, and spinal cord.9 WHO (World Health Organization) classification is the current international standard for glioma terminology and diagnosis. It divides gliomas into four grades (Grades 1 to 4) based on the degree of malignancy assessed by histological criteria.6 The standard treatments for GBM remain unchanged for many years- which involve surgical resection, chemotherapy, and radiotherapy, despite no cure discovered for treating this horrendous disease.7 The prognosis of GBM is very poor, which makes it a crucial public health issue.8 Glioblastoma is the most common malignant brain and other CNS tumors accounting for 47.7% of all cases. The incidence of glioblastoma is 3.21 per 100,000 people.
The median age of diagnosis is 64 years, and men are more likely than women to be diagnosed.8 Many efforts have been made by researchers and oncologists to understand the origin of GBM, but the reason still remains unclear. Due to this, the etiology of GBM remains unknown. The two hypothesis of GBM that suggest it’s origin are namely (1) GBM arises from rapid division of brain cells that leads to formation of tumours. (2) Other one suggests that GBM arises from Cancer stem cells(CSCs) that possess the ability to self-renew, differentiate and encourage tumor formation. The second theory suggests that GBM arises from normal neural stem cells once they acquire several different types of mutations in common neural marker cell genes.10 This points to the importance of understanding the mechanism behind how neural stem cells transform into Glioma neural stem cells via acquired mutations. This can be achieved by understanding the gene expression differences between GSCs and NSCs. The main goal of our study was to identify the underlying gene expression level changes between Glioma neural stem cells and Normal neural stem cells. Our main concern was to identify the affected biological pathways in Glioblastoma Multiforme which can be used as a potential tool for the cure of GBM. Identification of affected biological pathways would help further in the identification of molecular mechanisms which encourage CSCs to proliferate tumor formation. We wanted to find out potential key biomarkers for targeting CSCs which suggest the origin of GBM. Hence, in the present study, we investigate the transcriptomic profiles of 75 Glioma Neural stem cells samples and 59 Normal neural stem cells samples to understand the gene expression differences between them. After the identification of significant differentially expressed genes, we scrutinized the most affected biological pathways which revealed important results into the neuronal processes like synaptogenesis and progenitor dynamics as the transformations happen from CSCs to GBM or NSCs to GBM. Besides, the results presented here reveal new insight into the progression of GBM and the identification of novel genes involved in gliomagenesis.
METHODS
Software used in this study Server T-Bio Info
Website: https://server.t-bio.info/
The Principal component analysis, H-Clust. Heat Map plots and Differential gene expression analysis was done using this Cloud based server.
Metaboanalyst
Website: https://www.metaboanalyst.ca/
Metaboanalyst was used to generate PCA plots using the associated data set of this study
Enriehr
Website: https://maayanlab.doud/Enrichr/
The Gene ontology analysis was performed using the Enrichr Knowledge database.
Data Sets
In this study, the process of single-cell RNA high-throughput sequencing processed data for Glioma cancer stem cells was taken from NCBI GEO[GSE132172]. The dataset of this project was generated by Zhao Y et. al(2019) and was published as a bio project on NCBI with accession number(PRJNA546254). This dataset consisted of RNA-Seq data retrieved from CB660 normal neural stem cell lines and GliNS2 glioblastoma stem cell lines. A total of 134 samples were present on the associated SRA Run Selector, 59 samples of NSCs, and 75 samples of GSCs were selected and downloaded as an SRA Run [Table 1].
| Disease State | Number of Samples |
|---|---|
| Glioma Neural stem cells | 75 |
| Normal neural stem cells | 59 |
Data Pre-processing
The high throughput sequencing processed data was quantile normalized signal data. The processed data had gene symbols.
Down-stream Analysis Principal Component Analysis
To understand the patterns of gene expression in the data, comparative data analysis was performed using the Principal component analysis(PCA) module integrated on the T-bio info server (https://server.t-bio.info/). PCA is a dimensional reduction technique that is applied to larger data sets, in order to visualize the variation between samples in a particular data set.11 PCA was performed between these 2 conditions namely:
a. Glioma neural stem cells(GSCs) and (b) Normal neural stem cells(NSCs). Eventually, the PCA plots were generated using Metaboanalyst (https://www.metaboanalyst.ca/).12
Differential Gene Expression Analysis
The differential gene expression analysis was performed using the Deseq213 pipeline on the Tbio-info server to derive significantly differentially expressed genes between GSCs and NSCs samples. DESeq2 is a method for differential analysis of count data that uses shrinkage estimation for dispersions and fold changes to improve the stability and interpretability of estimates. This enables a more quantitative analysis focused on the strength rather than the mere presence of differential expression. The significant genes were identified with the threshold of (p.adj value <0.05, Fold change (>= ±1.5).14
Assessment of Discriminatory potential of Significant genes
In order to visualize and obtain the potential significant genes, H-clustering15,16 and a heat map17 were formed using the 134 samples (75 GSCs and 59 NSCs) with the selected set of significant RNA genes. H-clustering is an important technique of machine learning which is used to group similar data points such that the points in each same group are more similar to each other than the points in the other groups. The groups formed are known as “Clusters.” H-clustering (Distance: Euclidean, Linkage: average) was performed to understand the discriminatory potential of significant genes in distinguishing the gene expression patterns between GSCs and NSCs samples. Eventually, Heatmaps were drawn using the Tbio-info server in order to elucidate specific up-regulated and down-regulated genes out of the potential significant genes obtained using Deseq2.
Gene enrichment Analysis
In order to elucidate the biological significance of the differentially expressed genes, a gene set enrichment analysis18 was performed. Gene set enrichment analysis(GSEA) is a powerful analytical method to interpret gene expression data19 GSEA was performed using Enrichr Platform,20 which is an easy-to-use intuitive enrichment analysis web-based tool providing various types of visualization summaries of collective functions of gene lists. Further, Gene set enrichment analysis helped to understand the biological role of the significant genes in the process of gliomagenesis.
RESULTS
In this study, we analyzed the transcriptomic profile and data of the Glioma patient’s neural stem cells with that of the normal patient’s neural stem cells, in order to identify gene expression differences between them. The complete workflow of the study is represented in Figure 3.

- Work Flow of the study representing the key steps
Comparative Data Analysis
Data were analyzed using principal component analysis(PCA)21 in order to elucidate the variation between these Glioma neural stem cells and normal neural stem cells. Figure 4 shows the variation between GSCs and NSCs. The PC1 is 14.30% and PC2 is 4.34%.

- PCA between GSCs and NSCs samples
Downstream Analysis
It is evident from the PCA results Figure 4A that the variation between Glioma neural stem cells samples and Normal neural stem cells samples is maximum. Hence, we further carried out a comparative analysis between Glioma neural stem cells samples and Normal neural stem cell samples. Hence, in downstream analysis, we performed differential gene expression analysis between Glioma neural stem cells samples and Normal neural stem cell samples. Also, when the Glioma neural stem cells samples and Normal neural stem cell samples were examined in a specific scatter plot,22 it was obvious that there was an improvement in principal components, and the two groups were separated from each other which showed clear distinction. After the observed variation between these two groups-GSCs and NSCs, the reason for this difference and its impacts could be investigated at the transcriptomics level.
Differential gene expression analysis
The differential gene expression analysis23 between the Glioma neural stem cells(GSCs) and Normal neural stem cells(NSCs) samples scrutinized 1436 significantly differentially expressed genes between GSCs and NSCs [(padj. value <0.05, log2 fold change (>=+/-1.5)]. Among them, 619 genes were found to be significantly upregulated (p.adj value <0.05, Fold change >= +1.5) genes and 817 genes were found to be significantly downregulated (p.adj value <0.05, Fold change <= -1.5) in GSCs in comparison to NSCs.A volcano-plot for the differentially expressed genes can be seen in Supplementary Figure 1.

- Screenshot of PGA Pipeline on T-bioinfo Server
Clustering and Heat Map revealed variations among Glioma neural stem cells and Normal neural stem cells samples
Hierarchical clustering24 was performed in order to see clear variations between GSCs samples and NSCs samples. The main aim of hierarchical clustering was to understand if the significantly differentiated genes are capable of forming clusters based on their gene expression profiles. The clustering results show clear distinct variables between GSCs and NSCs samples as shown in Figure 5. The heatmap25 representing the expression patterns between GSCs samples and NSCs samples is shown in Figure 6.
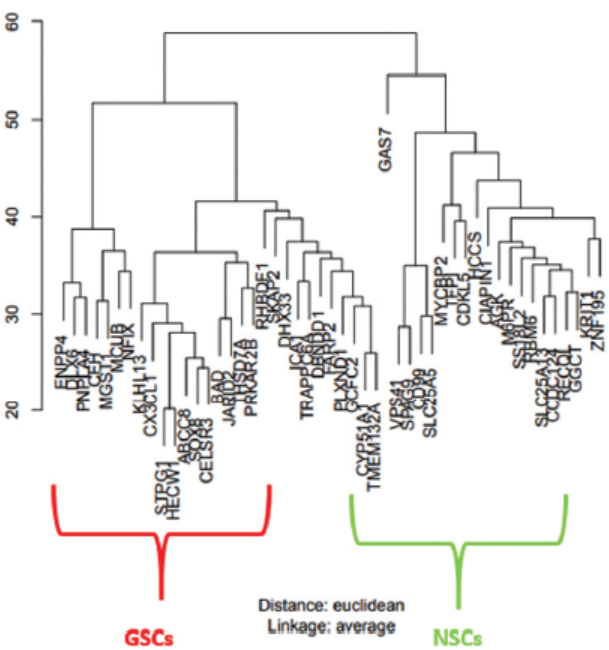
- Hierarchical Clustering results as dendrograms. Red box clusters indicate the GSCs samples, and the green one rep-resents the clusters of the NSCs samples

- Heatmap representing the Gene expression patterns of significantly differentially expressed genesclusters of the NSCs samples
Pathways involved in the pathogenesis of Glioma tumors by Gliomagenesis
To understand the involvement of the differentially expressed downregulated and up-regulated significant genes, pathway analysis26 was performed using the Enrichr27·28 knowledge database. Although the up-regulated genes showed involvement in varied types of pathways, some of the most important pathways were Axon guidance. Extracellular Matrix organization. Collagen binding pathways, and receptor-ligand binding pathways (Figure 7A).

- Gene ontology and KEGG pathway analysis of Up-regulated genes
The same method was applied to find out the involvement of down-regulated genes with different , biological pathways as shown in Figure 7B. The gene ontology analysis for down-regulated genes involved the Axon growth curve pathway, molecular nervous system development pathway, amyloid beta-binding pathways, and some of the amino acids metabolism pathway. On the basis of Principal Component analysis, there is a clear distinction of groups fonned between GSCs and NSCs samples which denotes variability. However, disruption of amino acid metabolism namely threonine, serine, and Glycine is what we focus our discussion and conclusions on. Interestingly, the disturbing biological processes of the axonal growth curve reveal many deeper insights herein into the process of gliomagenesis, which is also discussed further. The Gene ontology results show the involvement of genes like MAOA, MAOB, GATM, GLDC, AMT, and SHMT1 as the key features contributing to the disturbed processes of Glycine, threonine, and serine amino acid metabolism. Apart from this genes like COBL, FLRT3 and GPM6A contribute to the significantly downregulated disturbing process of the axonal growth curve in humans. The information about the differentially expressed 6 Genes identified in our study which are involved in disturbing Amino acid(Glycine, serine, and threonine) metabolism(p.adj value <0.05, Fold change <= -1.5) is given in Supplementary File 1(Figure 2).

- Gene ontology and KEGG pathway analysis of Down-regulated genes

- Deseq2 Pipeline for Differential gene expression Analysis on Tbio-info server
DISCUSSION
The origin of Glioma and progression of Gliomagenesis still remains unknown.29 With no known particular etiological aspect addressed to date, this calls for exploring further the role of glioma tumors. In this study using the RNA-Seq analysis approach on the transcriptomic profiles of Glioma and Normal neural stem cells, we have tried to establish a close connection between Glioma tumor formation and the underlying gene expression changes. Comparative data analysis using PCA revealed that the samples of both categories form separate clusters, depicting the vast genetic differences between the GSCs and NSCs samples. This drives a common theory that there is something at the transcriptomics level that leads to the variation between Glioma neural stem cells and Normal neural stem cells. Further studies with larger data sets would reveal the changes occurring exactly during this transformation at the gene level. Furthermore, based on the differential gene expression analysis using the Deseq-2 pipeline on the T-bio info server between the Glioma neural stem cells(GSCs) and Normal neural stem cells(NSCs) samples we scrutinized 1436 significantly differentially expressed genes between GSCs and NSCs[(padj. value <0.05, log2 fold change (>=+/-1.5)]. Among them, 619 genes were found to be significantly upregulated (p.adj value <0.05, Fold change >= +1.5) genes and 817 genes were found to be significantly downregulated (p.adj value <0.05, Fold change <= -1.5) in GSCs in comparison to NSCs. Later, the dendrograms, heat map, and Hierarchical clustering revealed the significance of significantly expressed genes between GSCs and NSCs samples. A heat map generated from these genes showed that some of the genes were downregulated in GSCs samples whereas some of them were up-regulated in NSCs samples, highlighting differential expression in both populations.
Gene ontology analysis performed using Enrichr based on significant gene sets showed obvious involvement of genes in pathways like Axon growth curve pathway, molecular nervous system development pathway, amyloid beta-binding pathways, some of the amino acids metabolism pathway. Axon guidance. Extracellular Matrix organization. Collagen binding pathways, and receptor-ligand binding pathways. Furthermore, one of the most affected pathways as per our KEGG pathway analysis was the serine, threonine and glycine metabolism pathway. The associated genes with this pathway are MAO A, MAOB, GATM, GLDC, AMT, and SHMTl[as per Enrichr] as the key features contributing to the disturbed processes of Glycine, threonine, and serine amino acid metabolism. One of the main functions of the MAOA gene is to provide instructions for making an enzyme called monoamine oxidase A.30,31 Monoamine oxidase A breaks down molecules called monoamine by a process known as oxidation.32 MAOA usually is involved in the breakdown of the neurotransmitters serotonin, epinephrine, norepinephrine, and dopamine. 33 Studies have shown that low-levels of dopamine in tumor tissues Leads to an excess stress condition, however, the underlying reason still remains unknown.34 However, our study depicts down-regulation of Dopamine breaking gene MAOA which can be a possible reason for lower levels of dopamine in GBM. The incomplete breakdown of dopamine in this study, confirms the symptoms of GBM like hallucinations, depression, anxiety and delusions. One of the main functions of MAOB gene is to the oxidative deamination of biogenic and xenobiotic amines. Apart from this, in association with nervous system it plays an important role in in the metabolism of neuroactive and vasoactive amines in the central nervous system and peripheral tissues35 Neuroactive amines can act as neurotransmitters, neuromodulators, or neurohormones.36 Biogenic amines further important biological processes like cardiovascular control, circadian rhythms, emotions, as well as learning and memory.36 Our study here elucidates that down-regulation of MAOB gene could be a possible reason for disturbed processes of endocrine secretion, learning and memory in GBM. GATM gene plays an important role in catalysing the biosynthesis of guanidinoacetate and also in the nervous system development.37 In any biological system, poor organizational development may give rise to unwanted cells and ultimately leads to the formation of tumors, which is the possible reason for GBM formation here. Down-regulation of GATM gene is a vital factor playing a role in giving rise to GBM tumor formation since it depicts disturbed nervous system development. The main function of GLDC gene is providing instructions for making an enzyme called glycine dehydrogenase.38 Down-regulation of the GLDC gene itself portrays here the reason for the disturbed metabolism of glycine amino acid in GBM. SHMT1 is a protein coding gene responsible for glucose energy metabolism pathways. Studies have shown known association of SHMT1 gene with leukemia.39 However down-regulation of SHMT1 could possibly contribute to the aggressiveness of GBM. Since one of the main functions of biogenic amino acids is to support cells to make other cells, cell growth and also in DNA replication. Our study clearly depicts the dysregulation of crucial amino acids like Glycine, serine and threonine, which portrays a definite cause of GBM.
Apart from this, our study also portrays one of the most affected cellular processes that is the axonal growth cone. Axonal growth cone is responsible for determination of cell growth direction, extracellular motility(ECM), and provides growth direction of the axon in that direction.40 Studies have shown that disturbed ECM processes lead to invasion and motility in GBM.41 Since glial cells and axons in GBM lead to aggressive growth which ultimately to lethal tumor formation, could state lack of growth directions from axonal growth cone processes due to the down-regulation of this particular process in GBM. However investigation of the axonal growth cone pathway in association of GBM could help us gain more insights in progression of this horrendous disease. In association with this, drawing a conclusion to association of beta-amyloid protein binding pathways and it’s down-regulation in GBM, here reveal new insights in progression of GBM.
CONCLUSION
In this study, we investigated the properties of the amino acid metabolism-related gene set in glioma in a systematic and complete manner. First, we showed that gene sets related to amino acid metabolism might be used to stratify the clinical and molecular characteristics of gliomas, emphasising their importance in glioma malignancy. Then we looked at Ontology data to see whether pathways were linked to Glioma or GBM. These findings could lead to new discoveries in the field of glioma malignancy research and treatment.
Conclusively, our study revealed significant differences in gene expression between Glioma Neural stem cells and Normal neural stem cells samples. Importantly, we confirm and validate the significant down-regulation of 6 amino acid (serine, glycine and threonine) metabolism pathway-associated genes in GSCs in comparison to NSCs samples. This most likely reveals an important clue to the etiology of this fatal brain tumor.
In future studies, may be accessing the precise role of protein coding genes in relation with Glioblastoma multiforme could help us achieve therapeutic targets for GBM. However limited number of samples, was a limitation of this study, which could be overcomed with larger cohort datasets of GBM samples. Also, analysing the role of genes like COBL, FLRT3 and GPM6A which contribute to the significantly downregulated disturbing process of the axonal growth curve in humans, could help us achieve greater heights in treating this fatal brain tumor.
END NOTE
Author Information
Rutvi Vaja School of Science,
Department of Biomedical Sciences, Navrachana University, Vadodara, Gujarat, India
Acknowledgments:
The days would have passed far more slowly without the support of my friends, both at the my research workplace and around Navrachana University, whom I thank for putting up with my idiosyncrasies and for providing such a rich source of conversation, education and motivation. Finally, I wish to thank my parents for their love and encouragement, without whom I would never have enjoyed so many opportunities.
Abbreviations:
GBM: Glioblastoma Multiforme GSCs: Glioma Neural stem cells NSCs: Normal neural stem cells CSCs: Cancer stem cells PCA: Principal component analysis ECM: Extra-cellular Motility.
Funding: There was no Funding associated with this project.
Conflicts of Interest:
The author declare no conflict of interest.
Consent to Participate (Ethics):
This article does not contain any studies with human participants or animals performed by any of the authors.
Consent to Publish:
I, the undersigned, give my consent for the publication of identifiable details, which can include photograph(s) and/or videos and/or case history and/or details within the text (“Material”) to be published in this Journal. Therefore, anyone can read material published in the Journal.
Authors Contribution:
Rutvi vaja solely performed the data analysis and manuscript preparation for this project.
Avaibility of Data and Materials:
The data-set was downloaded from GEO-NCBI Repository. The daatset used for this study is GSE132172.
REFERENCES
- Glioblastoma Multiforme, Diagnosis, and Treatment; Recent Literature Review. Curr Med Chem. 2017;24(27):3002-3009.
- [CrossRef] [PubMed] [Google Scholar]
- Glioblastoma: Overview of Disease and Treatment. Clin J Oncol Nurs. 2016;20(5 Suppl):S2-8.
- [CrossRef] [PubMed] [Google Scholar]
- Emerging treatment strategies for glioblastoma multiforme. EMBO Mol Med. 2014;6(11):1359-70.
- [CrossRef] [PubMed] [Google Scholar]
- Carboxypeptidase E transmits its anti-migratory function in glioma cells via transcriptional regulation of cell architecture and motil-ity regulating factors. International Journal of Oncology. 2017;51(2):702-14.
- [CrossRef] [PubMed] [Google Scholar]
- CD90 Expression Controls Migration and Predicts Dasatinib Re-sponse in Glioblastoma. Clinical Cancer Research. 2017;23(23):7360-74.
- [CrossRef] [PubMed] [Google Scholar]
- Glioblastoma multiforme: the terminator. Proc Natl Acad Sci U S A. 2000;97(12):6242-4.
- [CrossRef] [PubMed] [Google Scholar]
- Molecular targeted therapy of glioblastoma. Cancer Treat Rev. 2019;80(101896)
- [CrossRef] [PubMed] [Google Scholar]
- Glioblas-toma Multiforme: A Review of its Epidemiology and Pathogenesis through Clinical Presentation and Treatment. Asian Pac J Cancer Prev. 2017;18(1):3-9.
- [Google Scholar]
- Aberrant signaling pathways in glioma. Cancers (Basel). 2011;3(3):3242-78.
- [CrossRef] [PubMed] [Google Scholar]
- Single-cell RNA-seq reveals that glioblastoma recapitulates a normal neurodevelopmental hierarchy. Nat Commun. 2020;11(1):3406.
- [CrossRef] [PubMed] [Google Scholar]
- Principal component analysis: a review and re-cent developments. Philos Trans A Math Phys Eng Sci. 2016;374(2065):20150202.
- [CrossRef] [PubMed] [Google Scholar]
- Moderated estimation of fold change and dispersion for RNA-seq data with DESeq2. Genome Biol. 2014;15(12):550.
- [CrossRef] [PubMed] [Google Scholar]
- Fold change and p-value cutoffs significantly alter microarray interpretations. BMC Bioinformatics. 2012;13(2):S11.
- [CrossRef] [PubMed] [Google Scholar]
- Understanding the concept of Hierarchical clustering Technique [Internet] Medium 2020 (accessed )
- [Google Scholar]
- Comparative analysis of gene expression profiles of OPN signaling pathway in four kinds of liver diseases. J Genet. 2016;95(3):741-50.
- [CrossRef] [PubMed] [Google Scholar]
- Modifiers of the Genotype-Pheno-type Map: Hsp90 and Beyond. PLoS Biol. 2016;14(11):e2001015.
- [CrossRef] [PubMed] [Google Scholar]
- Gene set enrichment analysis: performance evaluation and usage guidelines. Brief Bioin-form. 2012;13(3):281-91.
- [CrossRef] [PubMed] [Google Scholar]
- Gene set enrichment analysis: A knowledge-based ap-proach for interpreting genome-wide expression profiles. Proceedings of the National Academy of Sciences. 2005;102(43):15545-50.
- [CrossRef] [PubMed] [Google Scholar]
- Enrichr: interactive and collaborative HTML5 gene list enrichment analysis tool. BMC Bioinformatics. 2013;14(1):128.
- [CrossRef] [PubMed] [Google Scholar]
- Principal component analysis: a review and re-cent developments. Philos Trans A Math Phys Eng Sci. 2016;374(2065):20150202.
- [Google Scholar]
- Met-formin association with lower prostate cancer recurrence in type 2 diabetes: a systematic review and meta-analysis. Asian Pac J Cancer Prev. 2015;16(2):595-600.
- [CrossRef] [PubMed] [Google Scholar]
- RNA-Seq differential ex-pression analysis: An extended review and a software tool. PLoS One. 2017;12(12):e0190152.
- [CrossRef] [PubMed] [Google Scholar]
- Hierarchical clustering method to improve tran-srectal ultrasound-guided diffuse optical tomography for prostate can-cer imaging. Acad Radiol. 2014;21(2):250-62.
- [CrossRef] [PubMed] [Google Scholar]
- Research Tech-niques Made Simple: Whole-Transcriptome Sequencing by RNA-Seq for Diagnosis of Monogenic Disorders. J Invest Dermatol. 2020;140(6):1117-1126.e1.
- [CrossRef] [PubMed] [Google Scholar]
- Pathway enrichment analysis and visualization of om- ics data using g:Profiler, GSEA, Cytoscape and Enrichment Map. Nat Protoc. 2019;14(2):482-517.
- [CrossRef] [PubMed] [Google Scholar]
- Gene ontology enrichment analysis of congenital diaphragmatic hernia-associated genes. Pediatr Res. 2019;85(1):13-9.
- [CrossRef] [PubMed] [Google Scholar]
- Enrichr: a comprehensive gene set enrichment analysis web server 2016 update. Nucleic Acids Res. 2016;44(W1):W90-97.
- [CrossRef] [PubMed] [Google Scholar]
- cDNA cloning of human liver monoamine oxidase A and B: molecular basis of differences in enzymatic properties. Proc Natl Acad Sci U S A. 1988;85(13):4934-8.
- [CrossRef] [PubMed] [Google Scholar]
- Abnormal behavior associated with a point mutation in the structural gene for monoamine oxidase A. Science. 1993;262(5133):578-80.
- [CrossRef] [PubMed] [Google Scholar]
- Monoamine oxidase A (MAOA) genotype predicts great-er aggression through impulsive reactivity to negative affect. Behav Brain Res. 2015;283(97):101.
- [CrossRef] [PubMed] [Google Scholar]
- MAOA-uVNTR geno-type predicts interindividual differences in experimental aggressive-ness as a function of the degree of provocation. Behav Brain Res. 2013;247(73):8.
- [CrossRef] [PubMed] [Google Scholar]
- Anti-cancer effects of dopamine in human glioma: involvement of mitochon-drial apoptotic and anti-inflammatory pathways. Oncotarget. 2017;8(51):88488-500.
- [CrossRef] [PubMed] [Google Scholar]
- Molecular and pharmacological properties of insect biogenic amine receptors: lessons from Drosophila mela- nogaster and Apis mellifera. Arch Insect Biochem Physiol. 2001;48(1):13-38.
- [CrossRef] [PubMed] [Google Scholar]
- Monoamine oxidase A (MAOA) genotype predicts great-er aggression through impulsive reactivity to negative affect. Behav Brain Res. 2015;283(97):101.
- [CrossRef] [PubMed] [Google Scholar]
- Glycine and a glycine dehydrogenase (GLDC) SNP as citalopram/ escitalopram response biomarkers in depression: pharmacometab- olomics-informed pharmacogenomics. Clin Pharmacol Ther. 2011;89(1):97-104.
- [CrossRef] [PubMed] [Google Scholar]
- Glial Cell-Axonal Growth Cone Interactions in Neurodevelopment and Regeneration. Front Neurosci. 2020;14:203.
- [CrossRef] [PubMed] [Google Scholar]
- Mechanisms of Invasion in Glioblastoma: Extracellular Matrix, Ca2+ Signaling, and Glutamate. Front Cell Neu-rosci. 2021;15:663092.
- [CrossRef] [PubMed] [Google Scholar]


